Release Notes: September 2026
Over the past three months we’ve shipped a set of improvements to maps, reports, charts and Data Viewer. Here’s what changed and where to learn more.
Feature Updates
Report maps that cover every visit
Report maps can now do more of the work that used to happen by hand.
One map for many results
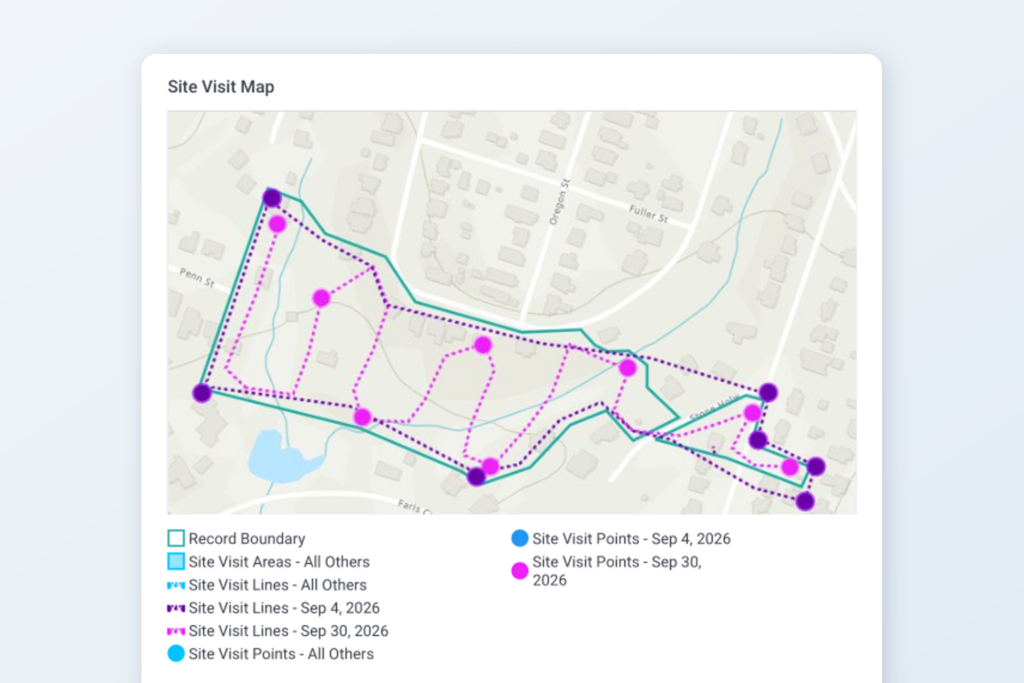
A map block in a report template can now draw a single map covering every record in the report, or every item in a repeated block, instead of one map per result. Use it for a portfolio overview or to show every observation from multiple visits on one page.
A style for every value, without the hassle
When you style a layer by a field attribute – like End Date or Status – Landscape can now create a color for each value it finds in the data. This means you no longer have to manually list every value and choose its style ahead of time.This is extremely useful for styling multi-visit maps where you want map data from each day represented as a different color.
Group dates by day, month or year
When you style by a date, you can group the values by day, month or year; for example, you might use this to color site visit tracks by the year they were walked.
Learn more: Showing Map Objects in Different Colors, Report Templates, and How to run a report for multiple site visits.
Choose the map your team sees when they open a record
Administrators can now set the default map for the whole account: which layers are turned on and which basemap appears when someone opens a record. In Settings > Map Layer Styles you can:
- check the record-specific and Work Item layers that should show by default,
- pick a Default Basemap, or make one of your Custom layers the account’s default basemap,
- turn Show this layer by default on or off for each Custom layer.
Each person can still adjust their own view. When you turn a layer on or off, or switch the basemap, Landscape remembers that choice for you on every map – including on the Portfolio and Project list pages – without changing what anyone else sees. The account default applies to each layer until a user sets their own preference for it.
Learn more: How to set map layer visibility and defaults.
Charts that build over time
Cumulative totals
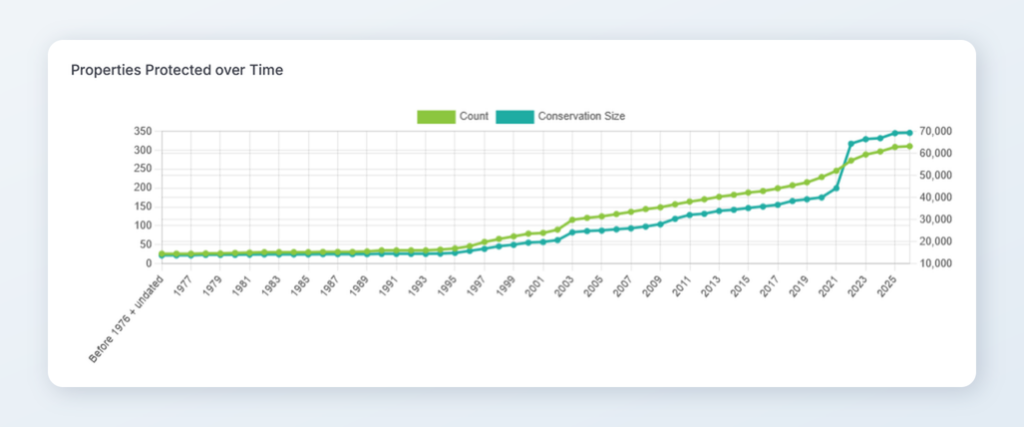
Charts have a new cumulative option that plots a running total, so a chart of acres protected by year can show how your total has grown over time.
Date groups that start where you choose
A chart grouped by date used to show a set number of years that moved forward every January. You can now set a start year, such as 1985, and the chart keeps that first year as time goes on.
Learn more: Dashboard Widgets and Editing the ‘Properties Protected Over Time’ Widget.
Data Viewer improvements
Resize columns
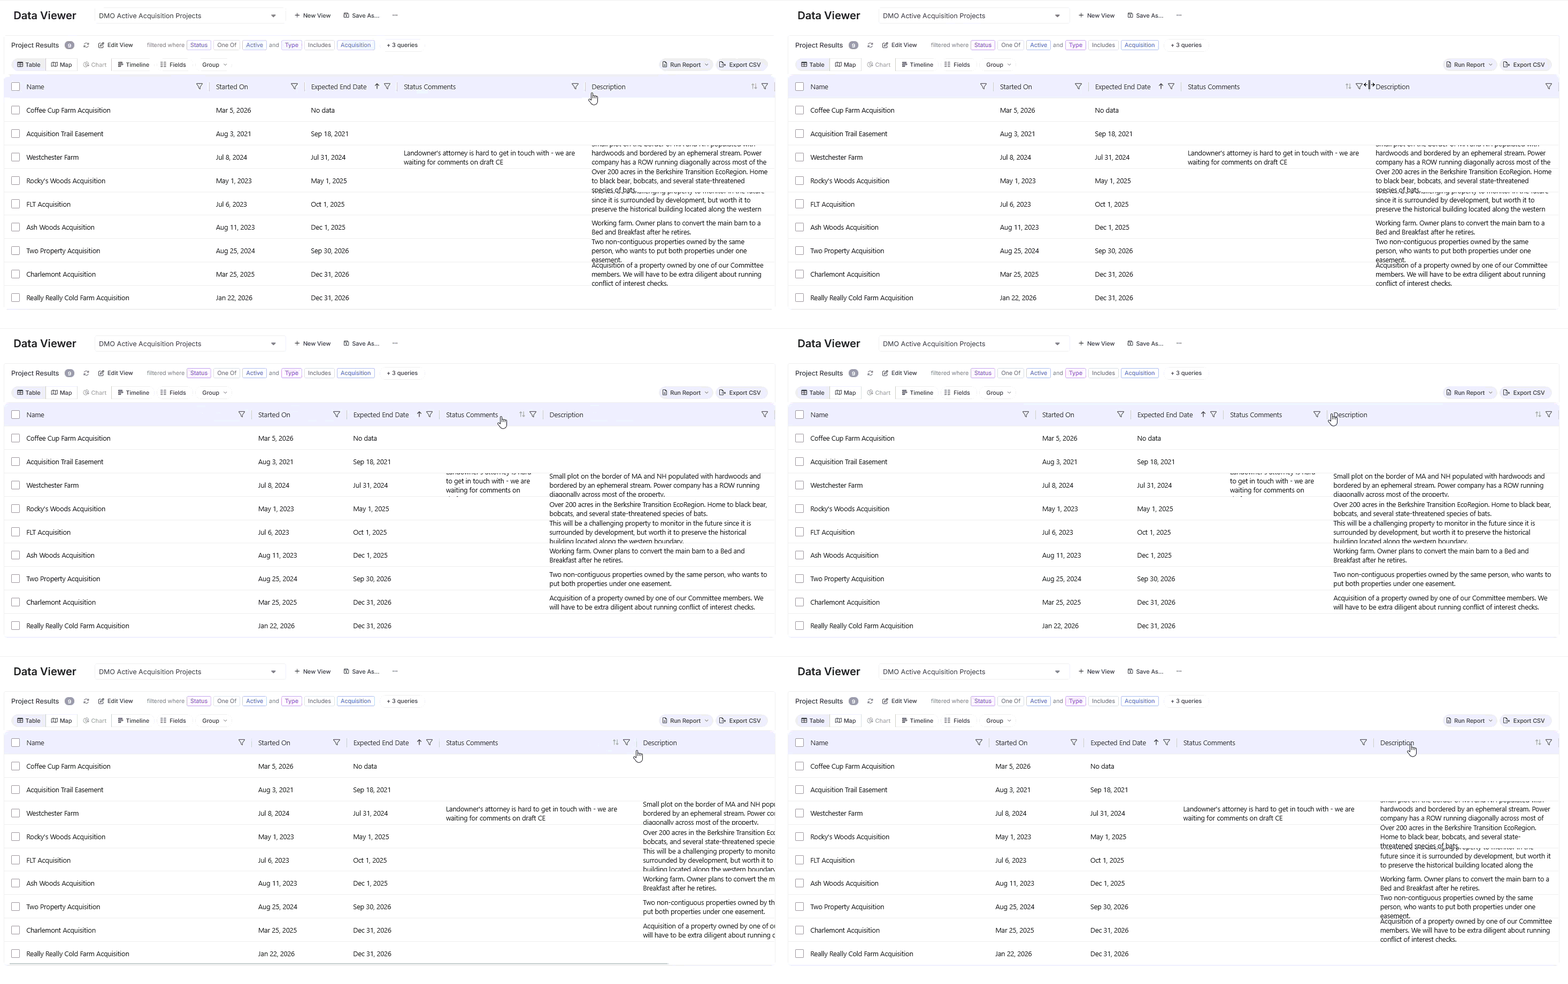
Now you can click and drag the divider between column headers to make a column wider or narrower, so long names and notes are readable without exporting. The grid layout has also been updated for better usability overall.
Learn more: Using Data Viewer
Other News & Updates
In Case You Missed It: There’s a new mobile app
Landscape Mobile 4 is available on Android and iOS. Landscape Mobile 4 builds on the features of Landscape Mobile 3, and allows users to capture more work in the field.


Always innovating and improving
We’re constantly working to make Landscape the best comprehensive tool for land conservation work. Always feel free to send us your suggestions for improvement by sending a message to support. We appreciate your feedback – it helps us to help you!
New to Landscape?
Working in Landscape connects your team and organizes your work and reports. The best way to see how Landscape can help your organization is by seeing a demo. Sign up for a demo today!