Release Notes: August 2025
We’re excited to share the latest round of updates to Data Viewer, Dashboards, and Reports, aimed at making the functionality of these powerful tools more transparent so that you can more easily create, edit, and summarize your data. Whether you’re exploring results, exporting data, or managing reports, these changes will help you more quickly get to the information you need.
Video Summary of Recent Updates
Watch the video below for a summary of the recent changes or read more below.
Data Viewer Improvements
View Owner Now Displayed
You can now see who owns each View if the owner is not the current user. This makes collaboration easier and helps you quickly identify the right person for questions or edits.
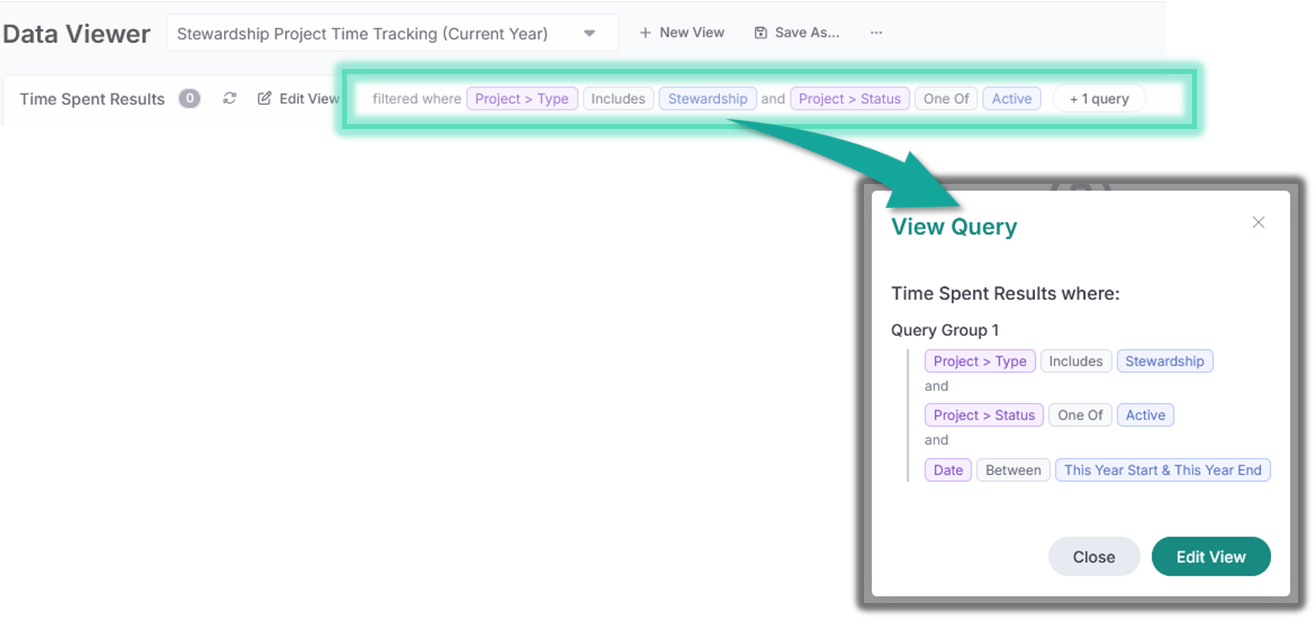
Query Preview on Results Page
Each View now displays a preview of the query used to generate the results. Want to see the full logic? Just click the preview to expand and view the full query—no need to hunt it down in the editor.
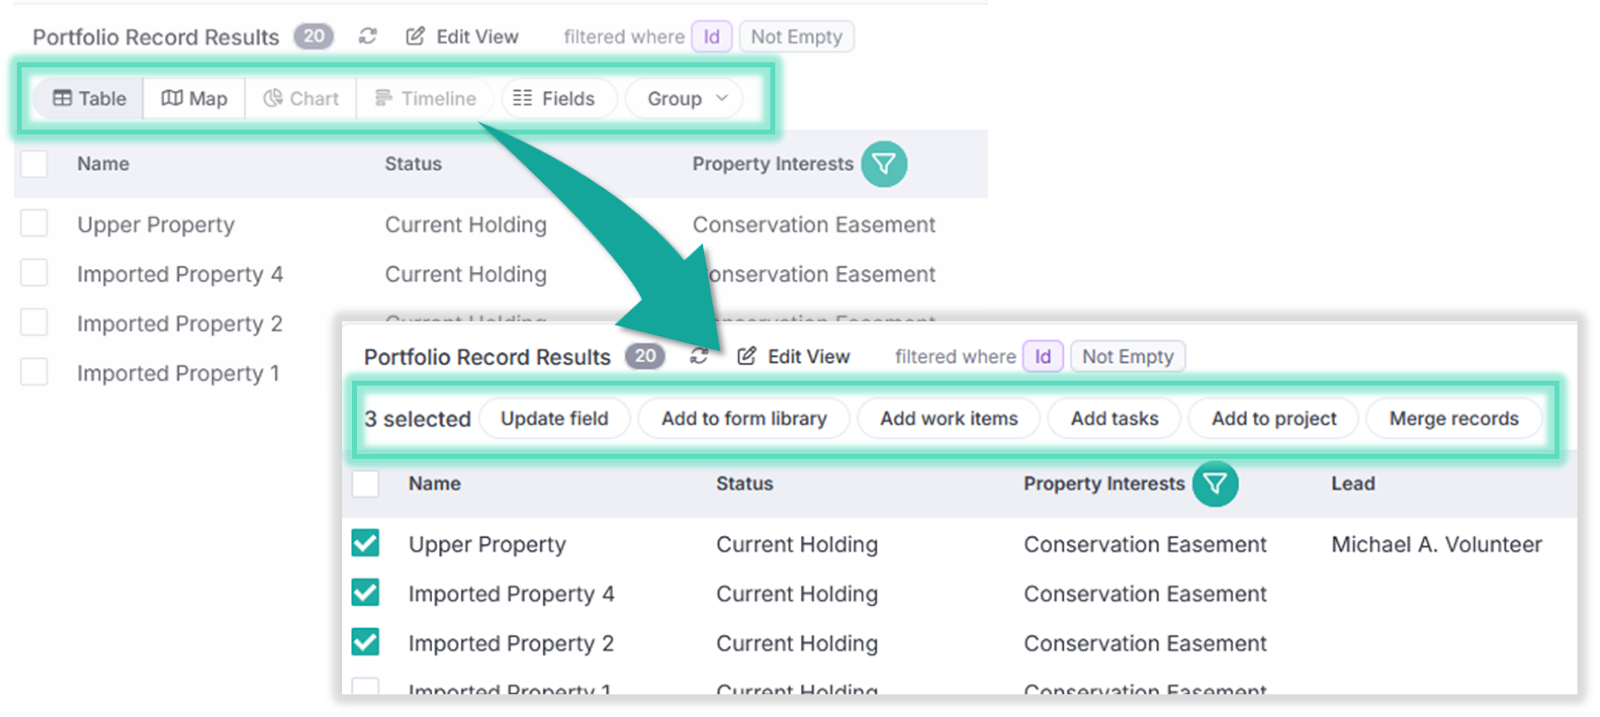
Dynamic Toolbar
All result display options now show at the top of the results list. When you select results, you’ll immediately see available actions (like updating fields, adding time tracking, merging records, etc.). This small change adds a big boost to efficiency.
New Views Open in Query Editor
Creating a new View? It now automatically opens the Query Editor, so you can get straight to building—no extra clicks required.
Reports Revamped
Reports Are Now on a Separate Page
All reports—including Saved Reports, One-Click Reports, and the LTA Accreditation Report—are now grouped in a single place for quicker access and better organization.
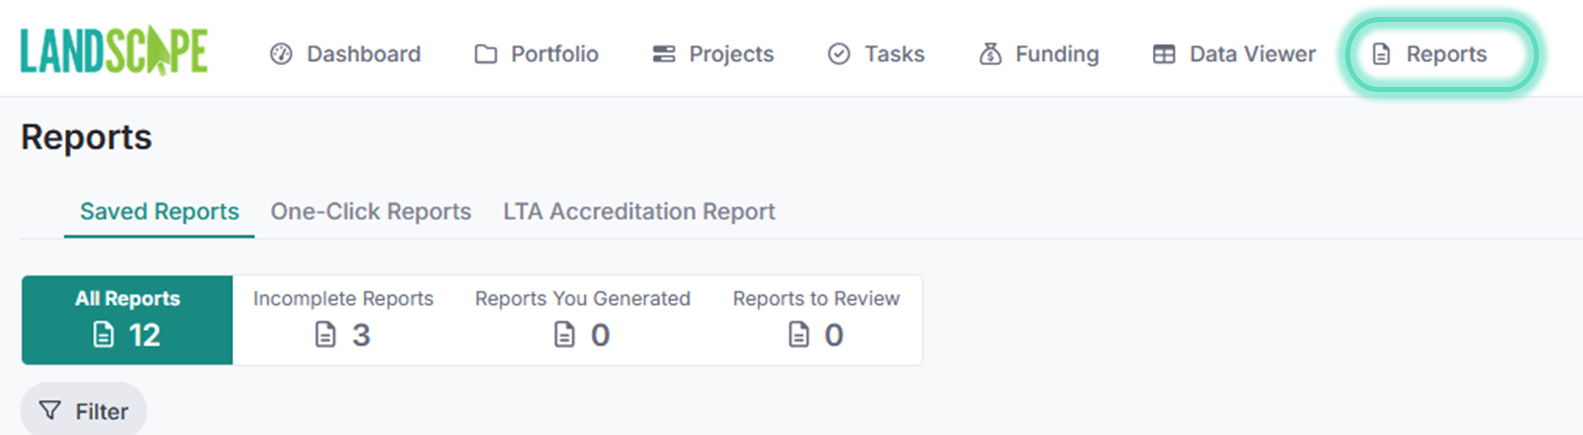
LTA Accreditation Report on Its Own Tab
To improve visibility and usability, the LTA Accreditation Report now has its own dedicated tab within the Reports page.
Dashboard Enhancements
Widget Owner & Query Info
The recent changes make Dashboards even more informative and collaborative. Like in Data Viewer, each widget now includes an info popup that shows the owner and the query used to generate the widget. This makes it easier to troubleshoot, reuse, or understand the context of your data visualizations.
These updates are all about giving you more context and more control. Whether you’re digging into data, sharing reports, or working on reaccreditation, everything’s just a bit more intuitive now.
As always, we love your feedback. Have a feature request or a comment on these updates? Let us know!
New to Landscape?
Working in Landscape connects your team and organizes your work and reports. The best way to see how Landscape can help your organization is by seeing a demo. Sign up for a demo today!