Release Notes: March 2024
Maps are essential for land conservation work and we aim to bring the best of what modern maps have to offer directly into Landscape. Last year, we made a lot of improvements to maps under the hood to give you a more speedy and smooth experience. This year, we revamped the map toolbar, improved feature selection in the map, added new tools to data and photo editing, and added styling options in the interactive maps and in report maps.
Many of these improvements and enhancements are feature requests submitted by you!
Read more about these features and see a full list of updates below.
New toolbar and easier editing flow
We revamped the map toolbar and made import tools like exporting and editing more accessible. Map feature editing is still context-dependent – meaning, you must navigate to a site visit to edit site visit data, for example. However, when you click the edit button, you begin editing all types of layers: points, lines, and areas. The import tool is smarter, so you don’t need to specify the type of layer before importing. And, you can now import or export a .csv of points.
Select multiple map features
We enhanced the ways that you can select features on the map.The selection tool behaves in a predictable way, where the features under the mouse click are selected. This allows you to click and select features, regardless of the layer display order, and quickly visualize or edit map data fields.
There are now a few different ways to select multiple features. You can now easily select multiple features by holding shift and clicking on features. We also added a multi-select tool that allows you to click and drag to make a selection rectangle. You can even hold shift to add to the selection by making many selection rectangles.
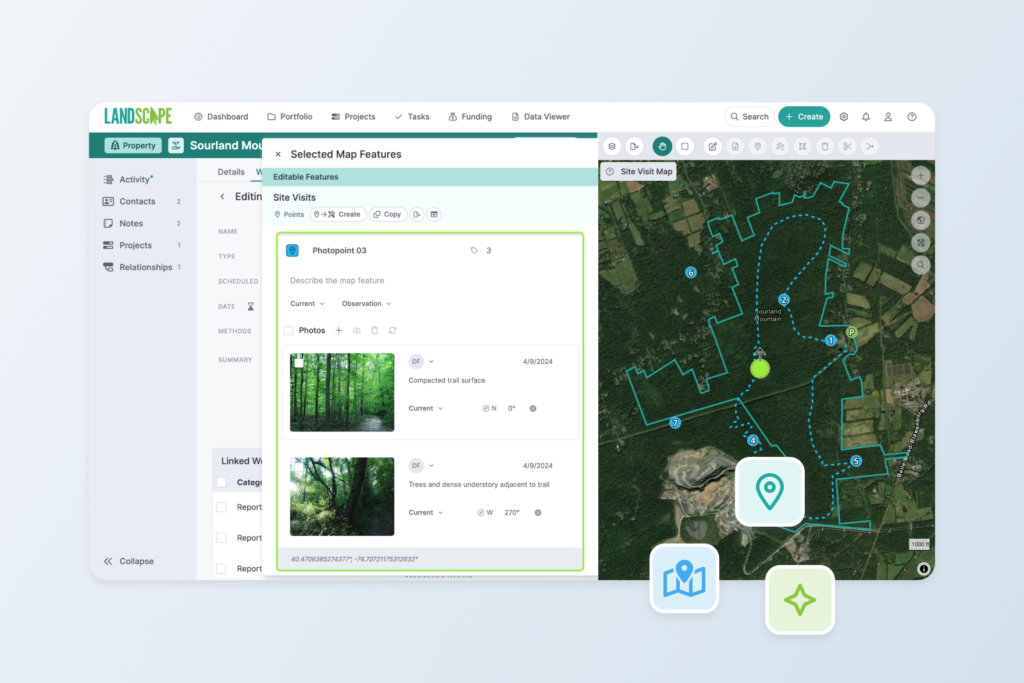
The selected map features panel is redesigned and displays map feature data fields and photo data fields in one list, for easy scrolling and editing.
Redesigned photo editor
You can now edit photos with ease by scrolling the selected map features panel. But, we also know that it’s helpful to see larger images while you’re describing photos. The new photo editor allows you to cycle through a carousel of all the photos that belong to a feature and edit their data fields.
Rename, renumber, reorder point features
We introduced a new tool that allows you to quickly reset the number, name, and label of multiple points in just a few clicks. Select multiple points and then use the interactive table to sort and drag to reorder point features. Then, use the renumber and rename tools to set the data fields for those points.
Photo direction arrows in reports
You asked and we delivered! You can now display photo direction arrows in print reports. You can toggle this option in the report template map content block editor pane.
Creating and copying made easier
Did you take a photo of a potential encroachment during a site visit? Maybe you documented the area where a landowner is requesting to build a barn. Select the map feature(s), click the Create button to create new work, like a new Issue or Tracked Right Activity, and track progress of resolving the issue or approving the exercised right.
Did you conduct a few different site visits to document baseline observations? Select all the site visit features and copy to a Baseline Report to get the data organized. Then, easily renumber the points using an intuitive sorting and renumbering tool.
Visualize satellite imagery basemap dates
It can be very important to know when the satellite imagery was captured when you are documenting characteristics or observations on a property. The ESRI World Imagery basemap now displays the date that the imagery was collected on interactive maps and report maps. This currently only applies to the ESRI World Imagery basemap.
More styling options
We added several data fields to the Style By options for map layers. This means that you can change the color and size of features based on data fields like “property interest”. We also added Style By options to the global map layer styles defined in Settings > Map Layer Styles. So, you could now set the “Nearby Boundaries” layer to display a different color based on the property interest like “Easement”, “Fee”, etc.
Report page orientation
You can now generate reports in landscape orientation. Configure this page setting option in the report template in Settings.
List of all recent updates
Map Functions
- `Shift` or `Ctrl` or `Apple Command` + `click` to add/remove to/from selected map items
- Edit tool now puts all types of layers into edit (points, lines, and areas)
- Import tool can import to any of the types of layers (points, lines, and polys) without user guidance
- Selected groups of features can be exported
- .csv files are an export option for point layers
- .csv files are an import option for point layers
Map Toolbar
- Change: Removal of Gallery button and Gallery view. Replaced by multi-select.
- Box-select tool on map toolbar
- Merge is now a tool on the toolbar
- Export is a tool on the toolbar
- Change: Removal of Info tool on map toolbar. Replaced by always displaying info and measurements in Selected Map Feature Panel
Map Layer List
- Style By Name now has search feature
- Geography fields to Style By now includes Record Name, Work Name, Project Name
- Export and edit controls removed from the 3-dot menu and placed in the map toolbar
- Point style now has Point size
- Nearby boundaries, Sub-Record Boundary layers can be styled by Record fields
- Change: “Record-Specific” layers are now “General”
Map Selected Feature Panel
- Create new work from the selected features is now a separate button/function
- Copy is now a function on the edit panel that works on all selected items within a layer/type group (i.e. Site Visit Points, or Baseline Lines)
- New point feature table editor for reordering/renaming points
- Feature geometry measurements (length & area) and coordinates display (for points) in edit panel
- Copy-to-clipboard button that allows user to copy the coordinates of a point for a selected feature
- Panel now shows groups of all selected features
- Edit photo data fields in a larger popup and cycle through photo carousel of all photos that belong to the selected feature
- New photo direction data field display with compass input
Map Canvas
- ESRI World Imagery shows date of imagery at close zoom levels; click date to display boundaries of image capture dates on the map
- Map labels disappear on overlaps in all contexts but reports, where they always overlap
Maps in Reports
- Point order field available in report photo blocks for sorting
- Display photo direction arrows in reports. Configure option in map block in report template.
- Legend is now grouped by layer and sorted based on the display stacking/order of the layers defined in the layers list
Other map changes
- The Export tool is now available on the map toolbar on the Portfolio page
- The search tool is available on Dashboard Map Widgets, Record maps, Project maps, and work maps; search an address to zoom to that location
- Settings > Map Layer Styles > UI now matches Map Layers List
- Settings > Map Layer Styles > Style By options can be applied globally to layer on every map
Video tour of new map features
Always Innovating and Improving
We appreciate your feedback – it helps us to help you! This major overhaul to maps came to be in large part due to your comments and requests.
Thanks for your help in making Landscape the best software for land conservation data and project management.
New to Landscape?
The user-friendly map features in Landscape make it possible for your whole team to create and edit the spatial data that is essential to your work. The best way to see how Landscape can help your organization is by seeing a demo. Sign up for a demo today!